This experiment, often called the "Big" Biodiversity Experiment, determines effects of plant species numbers and functional traits on community and ecosystem dynamics and functioning. The goal of E120 is to control plant species diversity in a well-replicated, long-term field experiment so as to determine the potential effects of plant species richness and plant functional-group richness on
(1) primary productivity of these grassland ecosystems and how this productivity is impacted by underlying interspecific interactions and ecosystem feedback effects that control soil carbon stores and soil fertilityprimary productivity;
(2) the stability of primary productivity in response to natural and experimentally induced climatic variation and in response to herbivores, pathogens, seed predators, and disease;
(3) the abundance of each planted species in each plot, and the effects of the traits of each species on its competitive and facilitative impacts on the abundances of all other planted species and on soil carbon stores and soil fertility;
(4) the effects of plant species abundance and diversity on the composition, abundances, stability and diversity of herbivorous insects, seed predators, predaceous insects, and parasitoids;
(5) the densities, dynamics, stability and habitat choice of small mammals;
(6) the dynamics of soil C, N, K, Ca and Mg. including rates of accretion, leaching losses, rates of mineralization, rates of fixation, and turnover of pools; and
(7) the dynamics, species composition and biodiversity of soil micro- and macro-organisms, including soil mycorrhizal fungi, nitrifying bacteria, other bacteria, other fungi, soil micro-arthropods, earthworms, and soil arthropods.
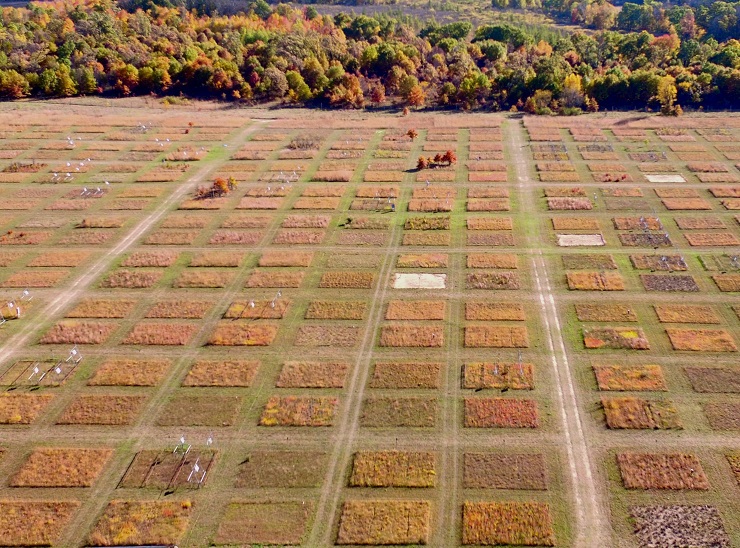
Biodiversity II is contained within a block of 342 plots laid out in a grid. Planted in 1994, it manipulates the number of plant species in 168 plots, each 9 m x 9 m, by imposing plant species numbers of 1, 2, 4, 8, or 16 perennial grassland species. The species planted in a plot were randomly chosen from a pool of 16 species (4 species, each, of C4 grasses, C3 grasses, legumes, non-legume forbs. Initially, two woody species (Quercus) were also included, but because neither survived the experiment’s annual burning, they were rapidly dropped from the experiment. The experiment’s long duration allows observation of slowly accumulating feedback effects that would be missed in shorter studies. The experiment’s high replication (>30 plots at each level of diversity) provides statistical power, and its large plots allow observation of responses of herbivorous, parasitoid and predator insects and minimize any effects that sampling might have on the observed responses.
The E120 Biodiversity experiment field.
Experiment Design
To initiate the experiment, a field at Cedar Creek Natural History Area, Minnesota, was treated with herbicide and burned in August, 1993, had 6-8 cm of soil removed to reduce the seed bank, was plowed and harrowed, then divided into plots of which 168 form this experiment. Plots for Biodiversity II were manually seeded in May 1994 using seed addition rates and methods like those of Biodiversity I. All plots received, in total, 10g/m2 of pure live seed in May 1994 with seed mass divided equally among species. Plots were planted with grassland perennial herbaceous. These plant species were in either the C4 grass, C3 grass, legume, or other forb functional groups. The species composition of the plots was chosen by separate random draws of the appropriate number of species (1, 2, 4, 8, or 16 plant species) from a pool of 16 species. For diversity levels 1, 2, 4, 8, and 16 species, there are 39, 35, 29, 30, and 35 replicates, respectively.
Reseeding
Due to insufficient water resources, the plots were not irrigated in 1994. Because a dry and windy spring led to some soil and seed erosion and to poor germination, plots were re-seeded in May 1995, at half the 1994 rate, and watered once or twice weekly with an irrigation system. Two species that did not germinate in 1994 were replaced with different species in the same functional groups in the 1995, with their seeding proportionate to 10g/m2 or pure live seed. Three species (Elymus canadensis, Poa pratensis, Panicum virgatum) did not establish in one of their two original monocultures, even after reseeding, and these three plots were abandoned after 1996. All plots were mown in July 1994 to help control weeds, and manually weeded in August 1994. They were manually weeded twice in 1995, four times in 1996, and three or four times from 1997 onward.
Herbicide application
Selective herbicides were also used through 1997. Plots that were designated to contain only legumes and/or other forbs were sprayed with Assure (Quizalofop P-ethyl (Ethyl(R)-2-[4-(6-chloroquinoxalin-2-yl oxy)-phenoxy]propionate)), a selective herbicide against grasses, twice each growing season from 1994 through 1997. The plots designated to contain just grasses were sprayed twice a year for 1994 through 1997 with 2,4-dichlorophenoxyacetic acid, a selective herbicide against forbs.
Seed lot issues
There were two problems in implementing Biodiversity II. The first concerned the legume Petalostemum villosum. It had, as a seed contaminant, a congener P. candidum, causing both species to be planted, but at approximately half the desired density for each species, in plots designated for P. villosum. Moreover, seed of the legume Amorpha canescens was inadvertently substituted for the legume P. villosum in 16-species plots. Second, because virtually no Solidago rigida, a non-legume forb, germinated during 1994, we reseeded all plots planted originally to Solidago rigida with a different non-legume forb, Monarda fistulosa. Some Solidago rigida did germinate in 1995 and it occurs in plots where originally planted.
Location
The experiment occupies a 10 hectare block of land in a former "brome field" on the land that formerly was part of the Alvar Peterson farm.
Other Plots Within the Experimental Block
Plots within the experimental zone which are not used in E120 are 76 additional plots that had functional group compositions drawn from an augmented species pool, 46 plots planted to 32 species, and 48 plots designated for other uses.
Numbering of the plots for the Biodiversity II field
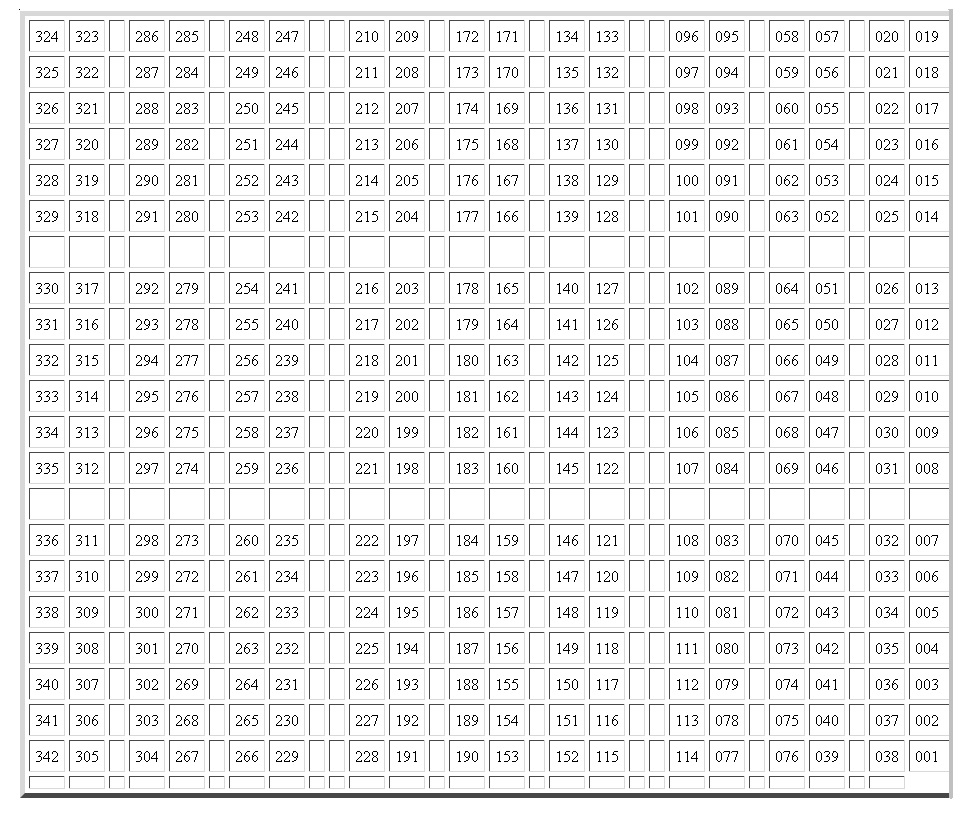
Plots are numbered starting from the northeast corner, incrementing left to right in odd rows and right to left in even rows. Walking paths separate every row and driving paths divide the plots into 6x6 groups in the following arrangement. There are 18 Rows with 19 plots each.
Seeding rates
To assure adequate establishment, plots were seeded both in 1994 and 1995. Rates for 1995 are related to those of 1994 by an adjustment factor, with one factor for plots that retained their identities and another factor for plots in which species were changed or added. Factors for plots that were changed are marked with asterisks (*) below. Columns labelled B, C, D, etc. contain the grams of seed applied per plot for the corresponding treatment. The Seeding Rates table, (in the Method Tables), describes the species planted within any of the 342 plots in the block of plots containing the plots for E120.
Species Assigned to Each Plot
Species assigned to each plot are listed in table, “Species Assigned to Each Plot” in the Treatment Tables.
Treatments applied to plots
A plot and functional group code shows which functional groups are present in the plot, with the left-most column representing C-3 grasses, the second column representing C-4 grasses, the third representing forbs other than legumes, the fourth representing legumes, and the fifth representing woody plants. Again, if a column is 1, the corresponding group is present in the plot. If 0, it is not. For example, Plot 3 has group code 01100, which means the plot has both C-4 grasses and forbs other than legumes, but nothing else.
See table “Treatments Applied to Plots” in the Treatment Tables.
Burning
All plots in Biodiversity II were burned each spring in late April or early May before plant growth had begun.
Treatment Tables
Download treatment tables (zip file)
Data
Select Publications:
The influence of functional diversity and composition on ecosystem processes
D Tilman, J Knops, D Wedin, P Reich, M
1997 Science 277 (5330), 1300-1302
Plant chemical traits define functional and phylogenetic axes of plant biodiversity
GN Furey, D Tilman
2023 Ecology letters 26 (8), 1394-1406
Plant biodiversity and the regeneration of soil fertility
GN Furey, D Tilman
2021 Proceedings of the National Academy of Sciences 118 (49), e2111321118
Biotic homogenization destabilizes ecosystem functioning by decreasing spatial asynchrony
S Wang, M Loreau, C De Mazancourt, F Isbell, C Beierkuhnlein, ...
2021 Ecology 102 (6), e03332